
“I can’t change the future, but I can change the present.” – John Connor
While pundits discuss the long-term possibility of “singularity” – the hypothetical moment in time when exponential technological growth becomes uncontrollable – something much more immediate is happening: Small-Cap ETFs tumble while Large-Caps rise. The performance gap is dramatically widening!
Small-cap ETFs posted their worst weekly performance in months, down more than 3%, while large-caps continued their upward climb, gaining 1-3%.

Source: Bespoke
This divergence in performance is widening the year-to-date (YTD) gap between the two equity groups, with the Nasdaq 100 ETF (QQQ) up 42.7%, the S&P 100 Mega-Cap ETF up 23.5%, and the Russell 1000 Index ETF up 15.4%.
On the other hand, the S&P MidCap 400 ETF is down 2.5% YTD, the Russell 2000 ETF is down 2.2%, and the iShares Micro-Cap ETF (IWC) is down a whopping 11.5%.
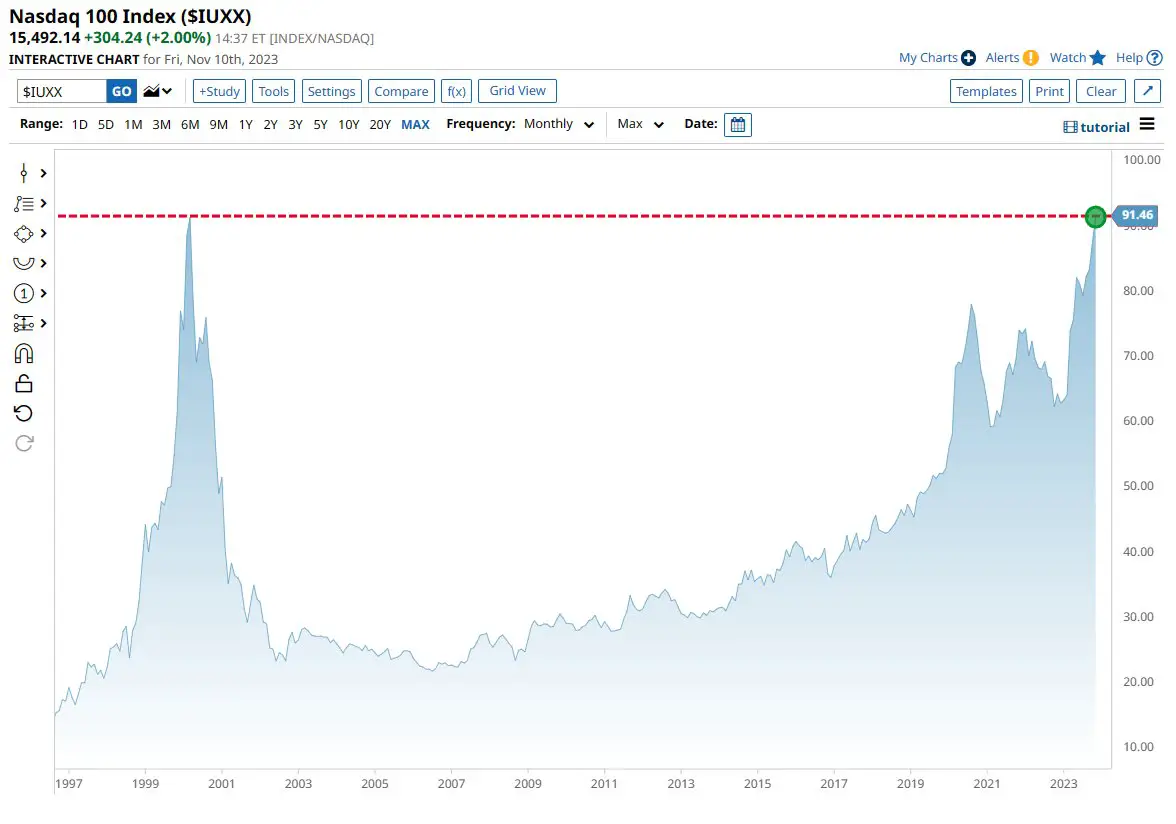
Large-cap tech stocks are now outperforming small-cap stocks by the widest margin in history, even surpassing the peak of the dot-com bubble. This trend is evident when we zoom out and examine long-term performance patterns. Take a glimpse at the chart offered by BarChart!

Source: Barchart
Against the backdrop of analysts dramatically ramping up their 12-month forward EPS estimates, the top 7 mega-cap tech stocks’ expected EPS estimates are now diverging dramatically from the S&P 500 average. This EPS divergence is a particularly telling development, as it suggests that analysts are becoming increasingly confident in the earnings growth potential of these mega-cap tech stocks, even as the overall market faces headwinds.

Source: Refinitiv, Capital Economics
AI advancements have been a clear driver of the performance gap between mega-cap and small-cap stocks, and mega-caps seem to have an edge in the AI race in terms of technology, applications, and resources.
Here are some reasons why mega-caps have an edge in the AI race:
Tech: Big tech companies have the money to invest in the latest and greatest AI research and development. They also have the best and brightest AI talent on the block.
Apps: Big tech companies have a lot of different businesses that can benefit from AI. For example, Amazon uses AI to make better product recommendations and improve its logistics system. Google is using AI to make its search engine and advertising platform better. Apple is also using AI to improve its most important products and services, like Siri, Maps, and Photos.
Money: Big tech companies have a lot of money to invest in AI infrastructure and software. They also have the money to buy AI startups.
This gives mega-caps a significant advantage in the development and deployment of AI technologies. As a result, they can disrupt existing industries and create new ones.
However, are tech valuations now too lofty?
Let’s examine the top 20 global stocks by their price-to-earnings (PE) ratios versus their consensus earnings per share (EPS) growth over the next five years. This metric (P/E vs EPS Growth) is known as PEG ratio, which is highly valued by legendary investor Peter Lynch. It is also one of my favourite metrics:

In absolute PEG terms

The following are some key takeaways:
- Nvidia (NVDA) is expected to grow at a much faster rate than its tech peers. However, it is also trading at a very expensive PE ratio.
- Tesla (TSLA) and Amazon (AMZN) are also trading at expensive PE ratios, but AMZN has at least strong EPS growth potential. TSLA, on the other hand, has both a high PE ratio and expected faltering growth. High valuations may be justified by the fact that TSLA’s AI advancements could completely change its business model and turn the company into a very profitable firm. However, there is also more execution risk and it is less clear how quickly or easily TSLA can implement its AI breakthroughs into its products and services offerings.
- Pharmaceutical companies Eli Lilly (LLY) and Novo Nordisk (NVO) seem overpriced, and their breakthroughs in anti-obesity may be excessively benefiting the mega-caps.
- Apple (AAPL) seems to be the laggard of the “magnificent 7” in terms of expected growth, but the company from Cupertino is known for its surprise innovations. Despite not yet delivering on its AI promises in terms of immediate products and services, we know that AAPL is well-positioned in the sector, being one of the first movers in the space.
Let’s now turn to the tape! What does recent price action tell us about some of these key mega-caps and market perception? There are a few charts I would like to highlight!
I am not a chartist, but I think they could be very telling on market perception and positioning at this key juncture!
Loser:

Source: Finviz
Recently Undecided:

Source: Finviz

Source: Finviz
Most Recent Winners:

Source: Finviz

Source: Finviz

Source: Finviz

Source: Finviz
Happy trading !
InflectionPoint
Disclaimer
All views expressed on this site are my own and do not represent the opinions of any entity with which I have been, am now, or will be affiliated. I assume no responsibility for any errors or omissions in the content of this site and there is no guarantee for completeness or accuracy. The content is food for thought and it is not meant to be a solicitation to trade or invest. Readers should perform their investment analysis and research and/or seek the advice of a licensed professional with direct knowledge of the reader’s specific risk profile characteristics.
Leave a Reply